Configurare windows perchè tramite (WER – Windows Error Reporting) crei un user-mode minidump quando un’applicazione va in crash:
https://msdn.microsoft.com/en-us/library/windows/desktop/bb787181(v=vs.85).aspx
“Starting with Windows Server 2008 and Windows Vista with Service Pack 1 (SP1), Windows Error Reporting (WER) can be configured so that full user-mode dumps are collected and stored locally after a user-mode application crashes. Applications that do their own custom crash reporting, including .NET applications, are not supported by this feature (for those see http://www.codeproject.com/Articles/1934/Post-Mortem-Debugging-Your-Application-with-Minidu).
This feature is not enabled by default. Enabling the feature requires administrator privileges. To enable and configure the feature, use the following registry values under the
HKEY_LOCAL_MACHINE\SOFTWARE\Microsoft\Windows\Windows Error Reporting\LocalDumps
key.
| Value |
Description |
Type |
Default value |
| DumpFolder |
The path where the dump files are to be stored. If you do not use the default path, then make sure that the folder contains ACLs that allow the crashing process to write data to the folder.For service crashes, the dump is written to service specific profile folders depending on the service account used.For example, the profile folder for System services is %WINDIR%\System32\Config\SystemProfile.
For Network and Local Services, the folder is %WINDIR%\ServiceProfiles. |
REG_EXPAND_SZ |
%LOCALAPPDATA%\CrashDumps |
| DumpCount |
The maximum number of dump files in the folder. When the maximum value is exceeded, the oldest dump file in the folder will be replaced with the new dump file. |
REG_DWORD |
10 |
| DumpType |
Specify one of the following dump types:
- 0: Custom dump
- 1: Mini dump
- 2: Full dump
|
REG_DWORD |
1 |
| CustomDumpFlags |
The custom dump options to be used. This value is used only when DumpType is set to 0.The options are a bitwise combination of the MINIDUMP_TYPE enumeration values. |
REG_DWORD |
MiniDumpWithDataSegs | MiniDumpWithUnloadedModules | MiniDumpWithProcessThreadData. |
These registry values represent the global settings.
You can also provide per-application settings that override the global settings.
To create a per-application setting, create a new key for your application under
HKEY_LOCAL_MACHINE\Software\Microsoft\Windows\Windows Error Reporting\LocalDumps
(for example,HKEY_LOCAL_MACHINE\Software\Microsoft\Windows\Windows Error Reporting\LocalDumps\MyApplication.exe).
Add your dump settings under the MyApplication.exe key.
If your application crashes, WER will first read the global settings, and then will override any of the settings with your application-specific settings.
After an application crashes and prior to its termination, the system will check the registry settings to determine whether a local dump is to be collected.
After the dump collection has completed, the application will be allowed to terminate normally.
If the application supports recovery, the local dump is collected before the recovery callback is called.
These dumps are configured and controlled independently of the rest of the WER infrastructure.
You can make use of the local dump collection even if WER is disabled or if the user cancels WER reporting.
The local dump can be different than the dump sent to Microsoft.”
Testiamo quindi il tutto:
Creiamo un’applicazione nativa che vada in crash e chiamiamola WinDbgMinidumpTestCrash.exe (ecco il codice che utilizzerò per questo esempio)
#include <iostream>

using namespace std;

void main() {
	cout << "Hello, World!\n";
	cout << "Type a key\n";

	char c = 'a';
	cin >> c;

	// Crash!
	char *p;
	p[1] = 'b';
}
Abilitiamo quindi la generazione dei minidump per questa applicazione:
[HKEY_LOCAL_MACHINE\SOFTWARE\Microsoft\Windows\Windows Error Reporting\LocalDumps\WinDbgMinidumpTestCrash.exe]
"DumpType"=dword:00000001
"DumpFolder"=hex(2):43,00,3a,00,5c,00,74,00,65,00,6d,00,70,00,00,00
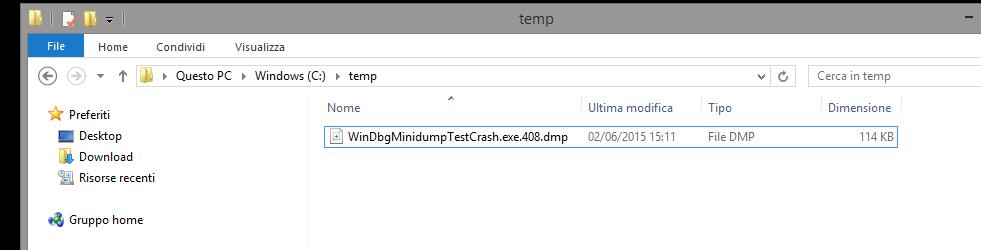
La cartella DumpFolder è “C:\temp”, il tipo di Dump è 1 (minidump).
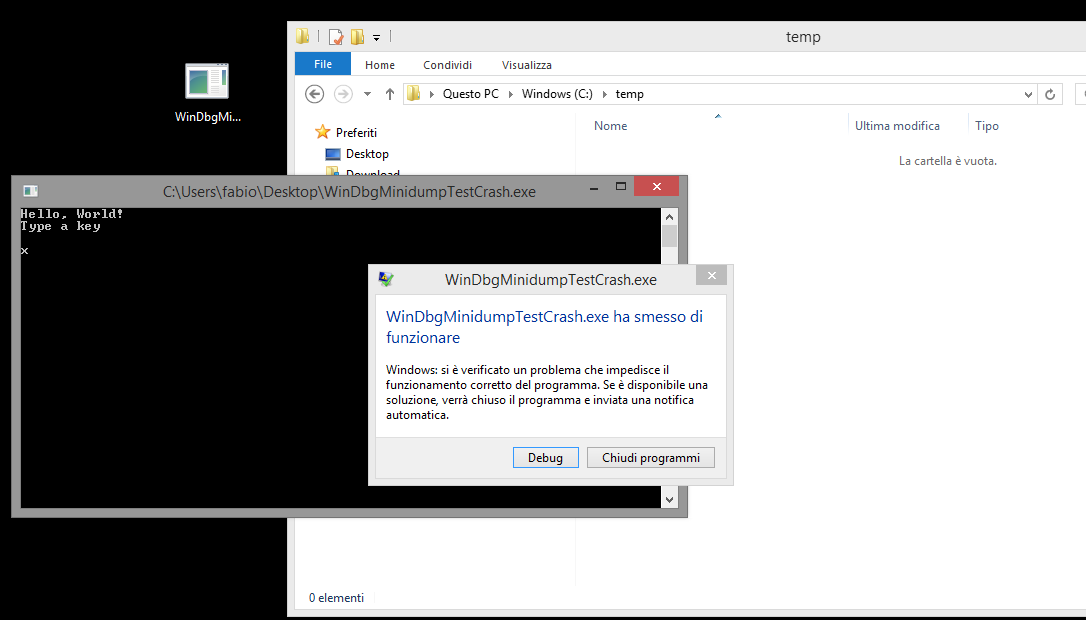
Lanciamo quindi l’applicazione che andrà in crash e genererà a questo punto il suo minidump all’interno di C:\temp


A questo punto dobbiamo andare a lanciare WinDBG e caricare il file di dump appena creato:
Solo caricando il file… ci ammonisce che abbiamo un’eccezione…

Configuriamo la cartella dove mettere i simboli delle classi di Microsoft
*** configure symbols to be downloaded from Microsoft
.symfix c:\symbols
Ricarichiamo il tutto (lasciamo il tempo al download dei simboli)
*** Reload anything which has been loaded so far
.reload

Poi andiamo ad eseguire il comando che WinDbg ci diceva di lanciare per accedere alle informazioni sulla nostra eccezione
.excr
E boom! Ecco la riga incriminata! 😀

Se andiamo a lanciare anche il comando
!analyze -v
Ecco che WinDBG ci mostra esattamente il punto anche nella finestra di comando:

Nel caso in cui il progetto con cui è stato compilato l’eseguibile non si trovi più nello stesso percorso (il modulo da errore di caricamento symboli):

occrre andare a dire a WinDBG dove trovare il .pdb e i sorgenti con gli appositi menu:

E richiamare nuovamente .ecxr

Ed ecco riapparire il nostro codice incriminato!
Ecco perchè a volte è bene tenere sotto versioning anche i file compilati e i file con i simboli di debug 😉

Mi piace:
Mi piace Caricamento...


